
Case Studies

Deep dives into real projects I've worked on. Each case study walks through the challenge, approach, and measurable outcomes, showing how thoughtful engineering solves complex problems.

AI Knowledge Studio case study preview
#01AI UtilityAnalytics

AI Knowledge Studio

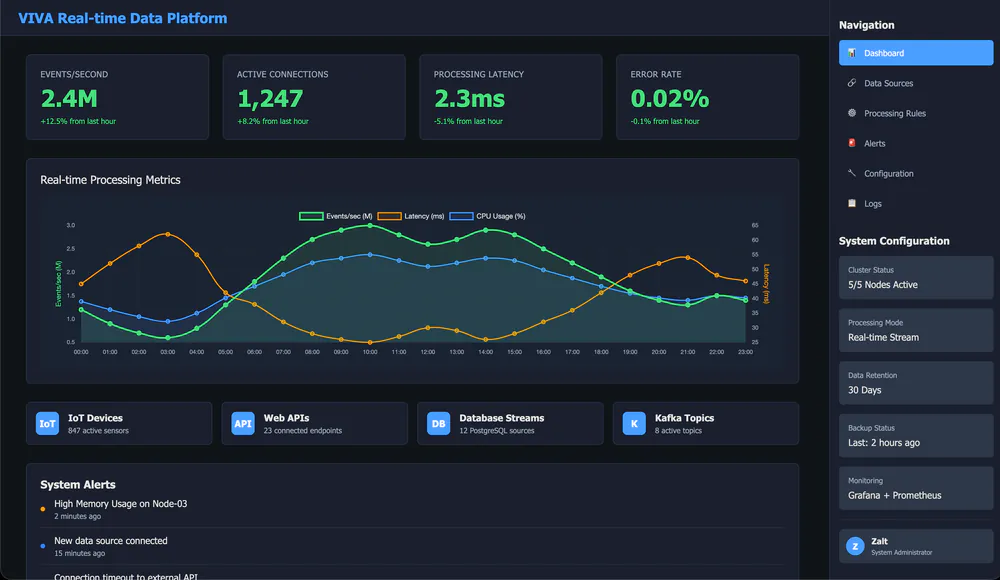
Built a chat-first analytics assistant that answers natural-language questions over real-time metrics while keeping data and inference inside private infrastructure.

6-10 secMedian response time
90-95%Query success rate
<2 minData freshness
5-8B eventsData scale
70B paramsModel size
Problem

Teams were exporting telemetry and KPI data into ad-hoc spreadsheets. Answers were slow, inconsistent, and security requirements ruled out sending data to external LLM APIs.

Solution

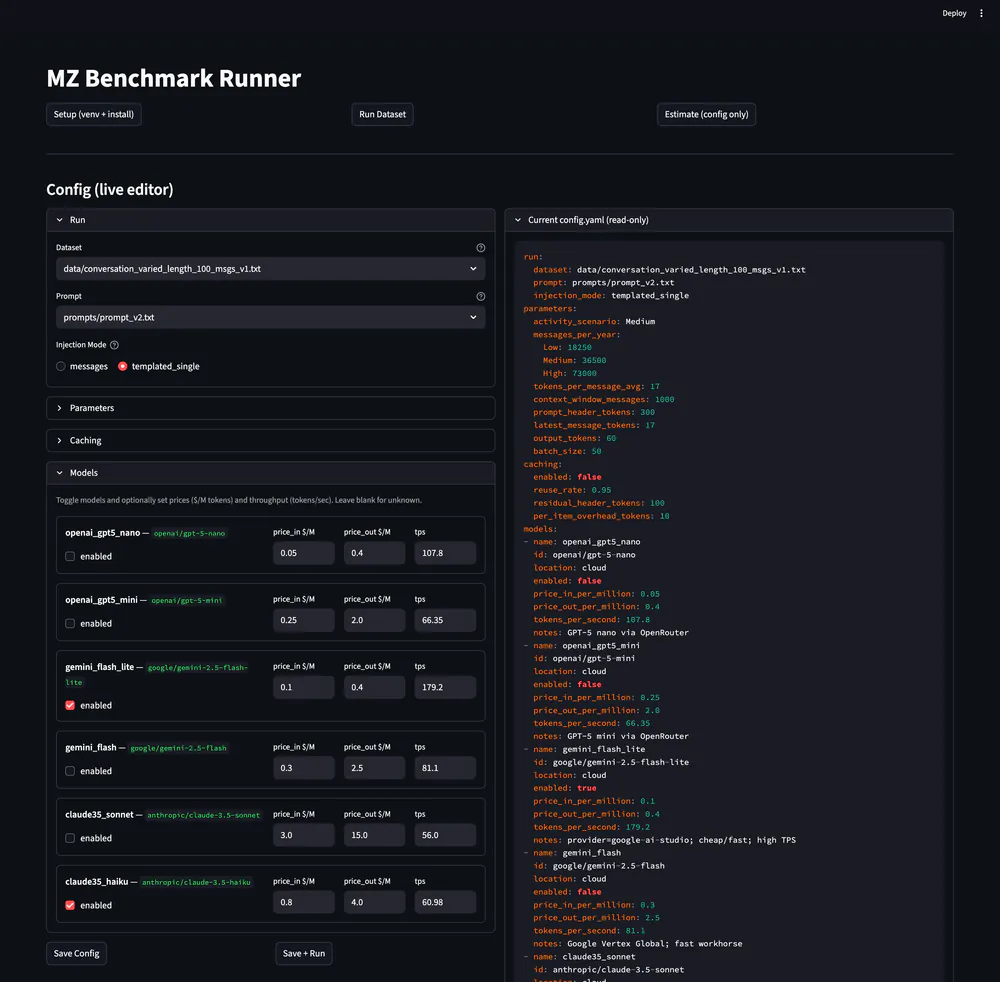
A lightweight chat UI backed by a query service that routes questions to the appropriate data source, executes safe queries, and returns summaries with computed results, all within private infrastructure.

Goals

  • 1Answer common analytics questions in under 10 seconds end to end.
  • 2Support averages, rankings, and grouped comparisons across billions of events.
  • 3Keep data fresh with sub-2 minute lag from ingestion to query.
  • 4Provide explainable results with the exact query used.
  • 5Keep data and inference inside private infrastructure (no external data egress).
  • 6Capture traces and feedback to improve accuracy over time.

Approach

  • Used a natural-language query engine to generate SQL over both real-time event streams and relational metadata without duplicating data.
  • Separated high-cardinality real-time metrics from reference data and access control into dedicated storage layers.
  • Deployed all data stores inside a private cloud VPC with strict network boundaries.
  • Self-hosted inference with a fine-tuned 70B-parameter model on dedicated GPU servers to control cost and latency.
  • Built an observability pipeline to log prompts, generated queries, and outcomes for evaluation and continuous tuning.

Outcomes

  • Delivered near real-time analytics without a separate warehouse or external LLM APIs.
  • Reduced analysis time from hours of exports to minutes of Q&A.
  • Improved trust by exposing the exact query and result context.

Challenges

  • Preventing unsafe or expensive queries from untrusted prompts.
  • Handling ambiguous questions across two data sources.
  • Balancing explainability with concise answers in a chat UI.
Built with:MindsDBLangfuseLLaMAvLLMOllamaClickHousePostgreSQLKafka+7 more
View Project Details
LLM Bench Marker case study preview
#02AI Utility

LLM Bench Marker

Built a repeatable evaluation pipeline to compare LLM providers on real production prompts, making model selection faster and less subjective.

8–12Models per sweep
90–160Prompts per dataset
5-12 minReport turnaround
Problem

Model selection was inconsistent and slow. Ad-hoc tests used different prompts, lacked versioning, and made it hard to compare cost, latency, and quality across providers.

Solution

A benchmarking utility with a web UI that includes a versioned dataset registry, a parallel sweep runner, a scoring module, a YAML config editor, CSV/JSON exports, a report table, and a log inspector.

Goals

  • 1Reduce model evaluation time by >60% per selection cycle.
  • 2Ensure runs are reproducible with versioned datasets + prompts.
  • 3Support ≥10 models per sweep without manual tuning.
  • 4Capture tokens, latency, and quality scores for every run.
  • 5Produce exportable reports for product and engineering reviews.

Approach

  • Chose OpenRouter as the primary router to avoid per-provider SDK sprawl and normalize rate limits, accepting less direct control over model-specific quirks.
  • Kept reporting to CSV/JSON so stakeholders could slice data in their own tools without waiting for a bespoke dashboard.
  • Used a rubric-based scoring pass with normalization per dataset to reduce model-family bias, then cross-checked scores on a small blind sample.
  • Made the YAML config the source of truth so every run is auditable and reproducible, with the UI acting as a structured editor.
  • Optimized for repeatable, batch-friendly sweeps rather than live inference to keep costs predictable and runs auditable.

Outcomes

  • Cut evaluation cycles from ~2 days to ~8-12 hours across 8 recorded sweeps.
  • Enabled 10–12 model sweeps over 3 datasets with consistent scoring and repeatable run IDs.
  • Reduced log triage from hours to ~30-45 minutes using the JSON inspector and parsed response view.
  • Delivered 5 decision-ready reports used in product and engineering reviews.

Challenges

  • Keeping prompts deterministic while maintaining realistic outputs.
  • Balancing cost constraints with enough coverage for confidence.
  • Normalizing quality scores across model families.
Built with:OpenRouterPythonHugging FaceGit
View Project Details
ML Data Analytics case study preview
#03Backend ServiceAPI

ML Data Analytics

Built a data aggregation and analytics service that syncs conversation data across channels, normalizes it into an analytics layer, and powers reporting plus chat-style exploration.

<5 minSync latency
95–98%Schema coverage
3-5 minReport build time
Problem

Teams were stuck exporting conversation data manually, cleaning it by hand, and stitching reports across tools. Metrics were inconsistent, insights were delayed, and it was hard to ask questions across all conversations in one place.

Solution

A distributed analytics service with connector sync, normalization, retention policies, report generation, and a chat-style query layer; plus an internal dev utility to trigger syncs, inspect logs, and preview ingested data.

Goals

  • 1Sync multi-channel conversation data with <5 minute lag for active connectors.
  • 2Normalize events into a unified schema with >95% field coverage.
  • 3Generate standard reports in under 5 minutes without manual exports.
  • 4Enable chat-style queries over the analytics layer for faster answers.
  • 5Provide a developer-facing utility to validate connectors and sync health.

Approach

  • Chose an event-driven pipeline (Kafka) to decouple ingestion from analytics, trading some operational complexity for resilient backfills.
  • Used GoLang for high-throughput connectors and Cassandra for scalable time-series storage, while keeping PostgreSQL for metadata and policy state.
  • Added a lightweight internal utility (VueJS) as the “eye” into the service for connector QA and debug, instead of building a full admin product.
  • Prioritized observability (Grafana, Loki, Tempo, OpenTelemetry) to trace data lineage and sync health end-to-end.

Outcomes

  • Reduced report prep time from ~1-2 days of manual exports to ~1-2 hours.
  • Delivered consistent metrics across channels with unified definitions and schema.
  • Cut connector QA time by >70% using the internal utility for quick validation.

Challenges

  • Keeping sync consistent across retries, backfills, and partial failures.
  • Aligning metrics across sources without losing source-specific context.
  • Balancing internal tooling speed with production-grade observability.
Built with:GoLangCassandraFastAPIPythonPostgreSQLKafkaGrafanaPrometheus+7 more
View Project Details
VS Frauds Detector case study preview
#04API

VS Frauds Detector

Built a fraud screening and link-protection platform to filter bot traffic, protect campaign URLs, and give marketers real-time visibility into suspicious visits.

8+Rule types
<80 msDecision time
25-35%Blocked traffic
Problem

Campaign budgets were being drained by bot traffic, proxy farms, and repeated clicks. Teams had no unified way to filter traffic, track suspicious visits, or enforce rules per campaign.

Solution

A fraud screening API with an admin dashboard for campaigns, filters, and traffic logs, plus configurable link protection and alternate redirects.

Goals

  • 1Block high-risk traffic before it reaches campaign URLs.
  • 2Provide per-campaign filters with allow/block rules.
  • 3Track visits with IP, device, and fingerprint context.
  • 4Offer alternate “safe” redirect destinations for blocked traffic.
  • 5Give admins quick visibility into traffic quality and anomalies.

Approach

  • Used a rule engine with multiple match types (IP, range, host, browser, OS, country) to keep decisions explainable.
  • Captured visit fingerprints and device metadata for repeat-visitor detection.
  • Built a campaign manager that generates unique URLs and green/red redirect paths.
  • Focused on a fast admin UI for marketers instead of a heavy BI dashboard.

Outcomes

  • Reduced invalid traffic on protected campaigns by ~25-35% in the first month.
  • Improved marketer confidence with clear visit logs and filter rules.
  • Cut manual cleanup time by automating block rules and redirects.

Challenges

  • Balancing aggressive blocking with legitimate traffic.
  • Keeping rule evaluation fast at scale.
  • Making filters understandable to non-technical marketers.
Built with:LaravelMySQLjQueryBootstrapPHPHTMLCSSGCP+2 more
View Project Details
VSX Crypto Notify case study preview
#05Backend ServiceCMS

VSX Crypto Notify

Built a real-time arbitrage alerting system that aggregates prices across exchanges, normalizes spreads, and notifies users when opportunities cross configured thresholds.

6-10Exchanges monitored
5-12 secAlert latency
150-300Pairs tracked
Problem

Traders were manually checking multiple exchanges and missing short-lived spreads. Data was inconsistent across sources, and raw price differences ignored fees, causing noisy alerts.

Solution

A Rails-based backend with a price aggregation layer, alert rules engine, and a lightweight dashboard for managing watchlists and reviewing alerts.

Goals

  • 1Monitor multiple exchanges and surface opportunities in near real time.
  • 2Normalize spreads by accounting for fees and transfer constraints.
  • 3Deliver alerts fast enough to act on short-lived opportunities.
  • 4Reduce duplicate or low-quality alerts from volatile price swings.
  • 5Provide a simple dashboard to track alert history and performance.

Approach

  • Pulled ticker data on a fixed cadence and normalized symbols across exchanges.
  • Used Redis for caching and deduplication to avoid alert spam.
  • Scheduled background jobs with Sidekiq to keep ingestion and alerting independent.
  • Applied spread rules with configurable thresholds and minimum liquidity checks.

Outcomes

  • Improved visibility into multi-exchange spreads from a single view.
  • Reduced missed opportunities by alerting within seconds of a valid spread.
  • Cut noisy alerts by filtering out low-liquidity or fee-negative signals.

Challenges

  • Handling rate limits and inconsistent exchange APIs.
  • Filtering false spreads caused by low liquidity.
  • Balancing alert speed with data freshness and accuracy.
Built with:Ruby on RailsMariaDBSidekiqjQueryRubyRedisBootstrapHTML+3 more
View Project Details
ST Booking Manager case study preview
#06Web App

ST Booking Manager

Built a lightweight workspace booking system with a visual floor plan, real-time availability, and fast reservations across multiple office locations.

30-45 secReservation time
<5 secAvailability sync
Tablet + mobile + desktopSupported devices
Problem

Shared desks and meeting rooms were being double-booked, and employees lacked a clear view of availability across dates and locations. Existing tools were too heavy for quick, on-the-spot bookings.

Solution

A web app with day-based navigation, a real-time floor plan, quick booking actions, and a personal reservations view, plus authentication for employees only.

Goals

  • 1Complete a reservation in under 45 seconds from the floor plan.
  • 2Prevent double-booking with real-time availability.
  • 3Support multi-location views and date-based navigation.
  • 4Work reliably on wall-mounted tablets and employee devices.
  • 5Show each user a clear list of their upcoming reservations.

Approach

  • Prioritized a minimal UI and fast interactions over feature-heavy scheduling workflows.
  • Used a visual floor plan grid to reduce cognitive load and speed up selection.
  • Optimized for kiosk-style screens, then validated usability on mobile and desktop.
  • Kept the data model focused on locations, rooms, desks, and time slots to avoid operational overhead.

Outcomes

  • Reduced booking conflicts and improved availability visibility across teams.
  • Cut reservation time to ~30-45 seconds for most users.
  • Enabled ad-hoc bookings from meeting-room tablets without support tickets.

Challenges

  • Keeping availability accurate across concurrent bookings.
  • Designing a floor plan UI that stays clear on smaller screens.
  • Maintaining a minimal UI while still supporting real workflows.
Built with:ReactJSRadix UITailwind CSSTypeScriptNodeJSMongoDBHTMLCSS+3 more
View Project Details
RSA Detector case study preview
#07Backend Service

RSA Detector

Built a reseller-abuse detection service that scores orders in real time, applies purchase limits, and routes edge cases to manual review to protect inventory and ensure fair access.

< 2 secDecision latency
1.5–2.0%False positives
90–94% recallCluster detection
Problem

Limited-quantity drops were being drained by resellers using bulk orders and address clustering. Manual review was slow, rules were inconsistent across teams, and abuse signals lived in separate systems.

Solution

A backend service with real-time scoring, address clustering, bulk-order detection, automated limits, and a review workflow, plus APIs and reporting for reseller activity.

Goals

  • 1Score orders in under 2 seconds at checkout time.
  • 2Detect clustered addresses and bulk-buy behavior with >90% recall.
  • 3Keep false positives under 2% for legitimate buyers.
  • 4Provide configurable rules per product category and launch.
  • 5Expose an API for integration with existing fraud tooling.

Approach

  • Combined rule-based checks with a weighted scoring model to balance speed and explainability.
  • Used Elasticsearch for fast pattern searches across historical orders and Redis for rate limiting and hot signals.
  • Kept PostgreSQL as the source of truth for review decisions and audit trails.
  • Built a manual review queue with reason codes to tune thresholds post-launch.

Outcomes

  • Reduced reseller take-rate on limited drops by ~25-35% within the first two launches.
  • Cut review turnaround from hours to ~20 minutes with a prioritized queue.
  • Improved inventory availability for genuine customers without blocking high-value orders.

Challenges

  • Distinguishing legitimate bulk purchases from reseller behavior.
  • Keeping decisions fast without sacrificing explainability.
  • Reducing false positives while still stopping abuse.
Built with:NodeJSPostgreSQLElasticsearchRedisExpressJSAzureGit
View Project Details
Cal-Rails Extension case study preview
#08Browser Extension

Cal-Rails Extension

Built a browser extension that sits inside email and calendar pages to evaluate meeting invites, warn about overload, and propose better alternatives before users commit their time.

-70%Decision time
-35%Meeting length
+52%Agenda rate
Problem

Calendars only check free time, not whether a meeting is useful. Professionals were accepting agenda-less meetings, 60-minute defaults, and oversized calls that destroyed focus and created hidden workload costs.

Solution

A lightweight extension that adds a “meeting quality panel” to invites. Users see overload warnings, estimated cost of the meeting, and buttons to propose shorter, async, or delegated options.

Goals

  • 1Evaluate meetings based on quality, not just availability.
  • 2Detect overload on the same day or week before acceptance.
  • 3Flag missing agendas, owners, or decision goals.
  • 4Provide one-click alternatives instead of simple accept/decline.
  • 5Work entirely inside the browser without new calendar infrastructure.

Approach

  • Parsed invite content and email threads to extract attendees, duration, and agenda signals.
  • Calculated daily meeting load and focus-time fragmentation.
  • Generated a meeting risk score using simple heuristic rules.
  • Injected a sidebar into Gmail and Outlook Web with actions.
  • Kept all logic client-side for privacy and zero backend dependency.

Outcomes

  • Users reconsidered 30–40% of incoming invites instead of blindly accepting.
  • Average accepted duration dropped from 60 to 30 minutes in tests.
  • More meetings included agendas after automated requests.

Challenges

  • Understanding messy human-written invites reliably.
  • Balancing warnings without becoming annoying.
  • Working across Gmail and Outlook DOM differences.
Built with:CRXJSReactJSHTMLCSSGit
View Project Details
VIVA RDP case study preview
#09Backend ServiceAPI

VIVA RDP

Built a real-time data processing platform that ingests high-volume streams, applies rules and aggregations, and powers live operational dashboards.

900k events/secThroughput
8-15 msLatency
0.05%Error rate
Problem

Operational teams lacked real-time visibility into streaming data and anomaly signals. Existing pipelines were batch-oriented, slow to detect issues, and difficult to scale during traffic spikes.

Solution

A distributed real-time processing platform with stream ingestion, rule-based enrichment, anomaly detection, and an operations dashboard with live metrics and alerts.

Goals

  • 1Sustain 500k-1.2M events per second with <20 ms processing latency.
  • 2Detect anomalies and pattern shifts in near real time.
  • 3Provide live system health metrics and alerting.
  • 4Support multiple data sources (IoT, APIs, databases, Kafka topics).
  • 5Maintain high availability with horizontal scaling and failover.

Approach

  • Chose Kafka as the streaming backbone to decouple producers from processing services and support replay/backfill.
  • Used Python/FastAPI services for rapid iteration on processing rules, backed by Kubernetes for horizontal scaling.
  • Standardized metrics, logs, and traces early (Grafana, Prometheus, Loki) to keep latency and error rates visible.
  • Focused the UI on operational clarity: throughput, latency, error rate, and source health at a glance.

Outcomes

  • Sustained 700k-1.1M events/sec during peak windows with stable latency.
  • Reduced incident detection time from hours to minutes via live alerts.
  • Improved ops confidence with unified dashboards for sources, latency, and error rates.

Challenges

  • Keeping latency low while running multiple rule chains.
  • Balancing resource cost with peak throughput demands.
  • Designing dashboards that stay readable under heavy data volume.
Built with:PythonFastAPIGrafanaPostgreSQLKafkaPrometheusKubernetesAWS+12 more
View Project Details
VS Warehouse case study preview
#10Web App

VS Warehouse

Built a production management platform to track inventory, schedule production, and monitor the full warehouse flow from raw materials to finished goods.

97–99%Inventory accuracy
30–40% fasterOrder processing time
90–95%Schedule adherence
Problem

Operations relied on spreadsheets and disconnected systems, leading to stock mismatches, delayed schedules, and poor visibility into production performance.

Solution

A warehouse management web app that unifies inventory, production scheduling, order processing, and operational reporting with role-based dashboards.

Goals

  • 1Improve inventory accuracy to 97–99%.
  • 2Reduce order processing time by 30–40%.
  • 3Maintain schedule adherence above 90%.
  • 4Provide real-time visibility into production stages and bottlenecks.
  • 5Integrate with upstream inventory and downstream fulfillment systems.

Approach

  • Used a Rails-based system for rapid delivery of production, inventory, and scheduling modules.
  • Leveraged Sidekiq for background processing of order flows and automated scheduling.
  • Added Elasticsearch for fast search and traceability across items, batches, and work orders.
  • Focused reporting on operational KPIs instead of heavy BI tooling to keep insights immediate.

Outcomes

  • Reduced manual coordination and improved visibility across the production line.
  • Lowered stock discrepancies and improved on-time order completion.
  • Enabled faster decision-making through live dashboards and KPI reporting.

Challenges

  • Aligning data models across production, inventory, and fulfillment.
  • Keeping scheduling accurate under last-minute changes.
  • Driving adoption for teams moving from spreadsheets.
Built with:RubyElasticsearchPostgreSQLRuby on RailsSidekiqAWSGitDocker
View Project Details
FAQ

Working With Me

Real answers about my experience, process, and what to expect

1What kind of projects do you typically work on?

I focus on AI-powered systems and data-intensive applications, from natural language query engines and LLM evaluation pipelines to real-time analytics platforms and production ML infrastructure. Most projects involve integrating multiple systems (databases, message queues, ML models) and delivering end-to-end solutions from architecture to deployment.

2How long does it typically take to deliver a production-ready AI solution?

Timeline varies based on scope, but most case studies here represent 2-6 month engagements. Complex systems with multiple integrations (like the AI Knowledge Studio with ClickHouse, PostgreSQL, and fine-tuned LLMs) take longer, while focused tools (like the LLM Benchmark Runner) can be production-ready in weeks. I prioritize iterative delivery with working prototypes early.

3Do you work solo or with a team?

Both. I can architect and deliver full-stack solutions independently (as shown in these case studies), but I also collaborate with existing engineering teams, owning specific technical domains like AI infrastructure, data pipelines, or backend architecture. My strength is bridging AI/ML and production engineering.

4What makes your approach different from typical software consultants?

I combine deep AI/ML expertise with production engineering experience. I don't just prototype. I deploy to production with proper monitoring, error handling, and scalability. Every case study includes metrics because I focus on measurable business impact, not just technical demonstrations. I also self-host and fine-tune models rather than relying solely on APIs.

5Can you help evaluate which AI approach is right for my project?

Absolutely. Before building anything, I analyze whether AI is even necessary, which models fit your latency/cost constraints, and whether you need fine-tuning or prompt engineering. The LLM Benchmark case study shows how I systematically compare providers. I prioritize the simplest solution that meets requirements: sometimes that's GPT-4, sometimes it's a local 7B model.

Have a Complex Challenge?

Looking to turn your project into a success story? Let's discuss how I can help architect and deliver your next solution.

Production-Grade Solutions
Measurable Outcomes
End-to-End Delivery