VIVA RDP
Backend Service, API
Project Summary
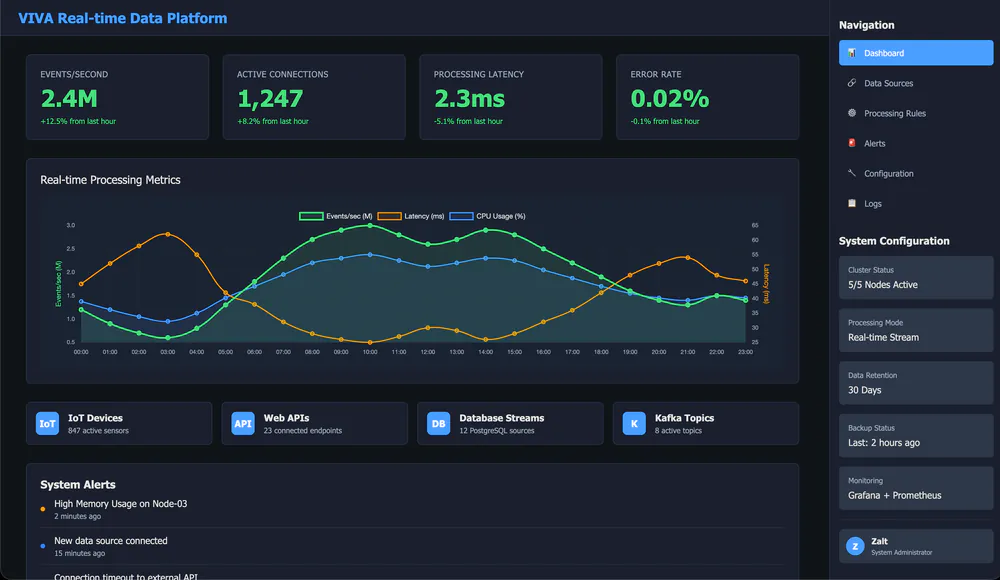
VIVA RDP is a high-performance system designed for processing and analyzing large streams of real-time data.
The system is built to handle millions of events per second, with features for real-time aggregation, pattern detection, and anomaly identification. It supports various data sources including IoT devices, web applications, and enterprise systems.
Key features include stream processing, complex event processing, and real-time analytics. The system provides tools for data enrichment, transformation, and routing to various destinations.
VIVA implements a distributed architecture to ensure high availability and horizontal scalability. It includes features like automatic load balancing, data partitioning, and fault tolerance.
The system is designed with monitoring and observability in mind, providing metrics, logging, and tracing capabilities. It also includes tools for managing data retention and archival.
Case Study
Overview
Built a real-time data processing platform that ingests high-volume streams, applies rules and aggregations, and powers live operational dashboards.
Problem
Operational teams lacked real-time visibility into streaming data and anomaly signals. Existing pipelines were batch-oriented, slow to detect issues, and difficult to scale during traffic spikes.
Solution
A distributed real-time processing platform with stream ingestion, rule-based enrichment, anomaly detection, and an operations dashboard with live metrics and alerts.
Goals
- 1Sustain 500k-1.2M events per second with <20 ms processing latency.
- 2Detect anomalies and pattern shifts in near real time.
- 3Provide live system health metrics and alerting.
- 4Support multiple data sources (IoT, APIs, databases, Kafka topics).
- 5Maintain high availability with horizontal scaling and failover.
Approach
- Chose Kafka as the streaming backbone to decouple producers from processing services and support replay/backfill.
- Used Python/FastAPI services for rapid iteration on processing rules, backed by Kubernetes for horizontal scaling.
- Standardized metrics, logs, and traces early (Grafana, Prometheus, Loki) to keep latency and error rates visible.
- Focused the UI on operational clarity: throughput, latency, error rate, and source health at a glance.
Results & Impact
Outcomes
- Sustained 700k-1.1M events/sec during peak windows with stable latency.
- Reduced incident detection time from hours to minutes via live alerts.
- Improved ops confidence with unified dashboards for sources, latency, and error rates.
Key Metrics
Timeline
Kafka + source adapters.
Aggregations, anomaly checks.
Metrics, alerts, source health.
Load testing, failover.
Challenges
- Keeping latency low while running multiple rule chains.
- Balancing resource cost with peak throughput demands.
- Designing dashboards that stay readable under heavy data volume.
Project Info
Want expert eyes on your architecture?
Strategy, design review, production readiness. Free initial consultation.
Get Expert Guidanceor book a free callLatest Articles
Programming insights and more.


Have a Project in Mind?
Let me bring your vision to life. From concept to launch, I deliver high-quality software with modern architecture and clean code.